How to Maximize Solar Energy Benefits in 2026?
Solar energy benefits are becoming more measurable, but they are not automatic. In 2026, homeowners and businesses must consider system design, local sunlight, electricity prices, storage, and maintenance. A larger panel array does not always deliver better value.
The International Energy Agency’s Renewables 2024 report projects that global renewable capacity will expand by nearly 5,500 gigawatts between 2024 and 2030. Solar photovoltaic systems are expected to provide most of that growth. IRENA’s Renewable Capacity Statistics 2025 recorded approximately 452 gigawatts of new solar capacity in 2024. These figures show strong momentum, yet global growth does not guarantee savings for every property.
Details matter.
A south-facing roof with limited shading can produce more useful electricity than a larger, shaded roof. A five-kilowatt system may perform differently under dust, snow, heat, or weak winter sunlight. Battery storage can improve resilience, but its cost, replacement cycle, and operating losses deserve careful review. The U.S. National Renewable Energy Laboratory also emphasizes that solar output depends heavily on weather, orientation, tilt, and system losses.
This guide examines practical ways to maximize solar energy benefits in 2026. It connects industry forecasts with decisions people can actually make, such as comparing installer estimates, checking performance warranties, and measuring household demand before installation. Some projections may change as tariffs, technology, and grid rules evolve. That uncertainty matters. Reliable planning requires current local data, transparent assumptions, and realistic expectations rather than impressive promises.
Solar Energy Basics and Its Role in 2026
How to Maximize Solar Energy Benefits in 2026?
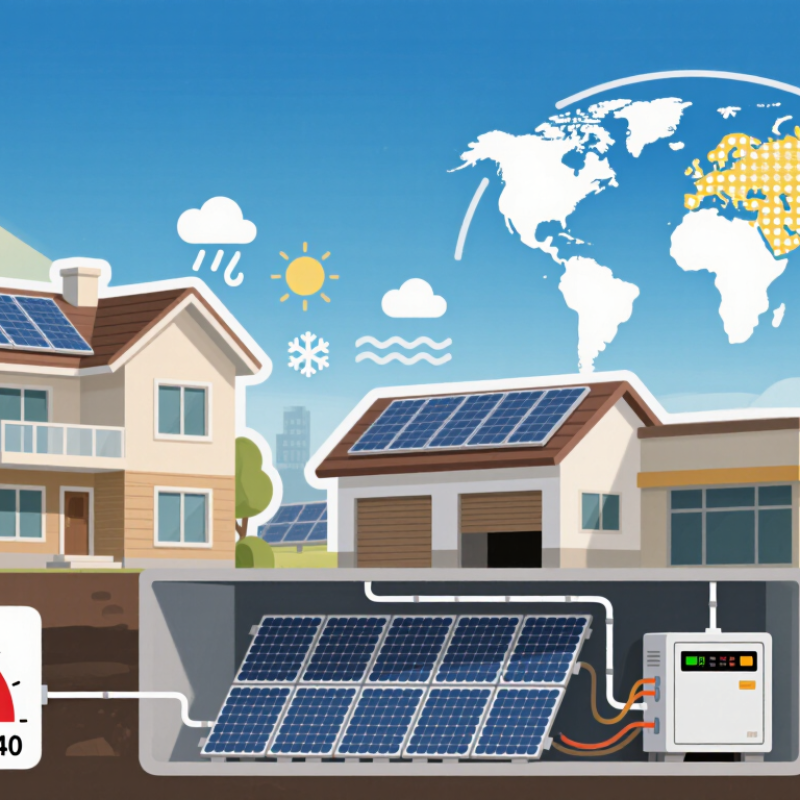
Solar energy begins with a simple process: photovoltaic cells convert sunlight into usable electricity. In 2026, this basic technology supports a rapidly changing power system. The International Renewable Energy Agency reported 452 gigawatts of solar capacity added globally in 2024. That represented most new renewable capacity that year. The International Energy Agency also expects renewable capacity to expand sharply before 2030, with solar providing the largest share. These figures show solar’s growing role in reducing fuel exposure and improving energy resilience. Yet sunlight is not constant. Cloud cover, seasonal changes, and grid congestion still limit dependable output.
A practical assessment should start with hourly electricity use, not roof size alone. An equator-facing roof usually performs well, but nearby trees can reduce production for several hours daily. Shade changes everything. Field studies also show that dust, inverter losses, and poor maintenance lower real-world output. I may have overestimated solar gains before by ignoring winter demand and evening consumption. A battery can shift midday generation into darker hours, but it adds cost, replacement needs, and safety requirements. The IEA estimates that global energy storage capacity must increase sixfold by 2030 in a net-zero pathway. For households and businesses, smart controls, efficient appliances, and realistic production estimates may deliver greater value than installing the largest possible array.
How to Maximize Solar Energy Benefits in 2026? - Solar Energy Basics and Its Role in 2026
A practical data guide to improving solar generation, reducing electricity costs, and integrating storage and efficient energy use.
| Data Dimension | Typical or Verified Value | Why It Matters in 2026 | Recommended Action |
|---|---|---|---|
| Solar resource | Approximately 2–7 kWh/m²/day of average daily solar irradiation, depending on location, season, shading, and weather. | Solar output is highly location-dependent, so the same system size can produce very different annual energy. | Use a site-specific solar assessment based on at least 12 months of local irradiation and weather data. |
| Commercial PV module efficiency | Roughly 15–23% for commonly available crystalline-silicon modules. | Higher efficiency produces more power where roof or land area is limited. | Compare annual energy yield, temperature performance, warranty terms, and usable area rather than efficiency alone. |
| System performance ratio | Approximately 70–90% after accounting for temperature, inverter, wiring, mismatch, soiling, and downtime losses. | Real-world output is always lower than the panel’s laboratory-rated output. | Minimize shading, keep modules clean when economically justified, and select properly sized inverters. |
| Orientation and tilt | An unobstructed orientation toward the equator generally maximizes annual production; tilt is commonly selected near the site latitude, then adjusted for local conditions. | Roof geometry, electricity price periods, snow, and seasonal demand can make an alternative orientation more valuable. | Optimize layout for annual yield and the timing of electricity use, not only maximum midday generation. |
| Temperature effect | Crystalline-silicon modules commonly lose about 0.3–0.5% of power for each 1°C increase above their rated cell temperature. | Hot conditions can reduce instantaneous output even when sunlight is strong. | Allow adequate ventilation beneath modules and use temperature coefficients when estimating annual yield. |
| Annual module degradation | Approximately 0.3–0.8% of output per year for many modern crystalline-silicon modules. | Long-term energy and financial estimates must include gradual output decline. | Use conservative degradation assumptions and inspect connections, mounting, and insulation periodically. |
| Expected operating life | PV modules commonly operate for 25–35 years; inverters and batteries may require replacement sooner. | A longer service life can spread installation costs over more kilowatt-hours. | Evaluate total lifetime cost, maintenance, replacement timing, and end-of-life recycling options. |
| Battery round-trip efficiency | Approximately 80–95%, depending on battery chemistry, inverter, operating temperature, and charge-discharge rate. | Stored solar energy is reduced by charging and discharging losses. | Size storage for the highest-value evening or backup loads rather than storing every surplus kilowatt-hour. |
| Self-consumption without storage | Often about 20–40% for homes with typical daytime occupancy, but the actual value varies widely with load patterns and system size. | Using solar power directly usually avoids conversion and storage losses. | Run water heating, cooling, laundry, pumping, and vehicle charging during sunny hours when practical. |
| Lifecycle greenhouse-gas emissions | Solar electricity typically has lifecycle emissions in the tens of grams of CO₂-equivalent per kWh, substantially below fossil-fuel electricity. | Solar can reduce operational emissions when it displaces higher-emission grid generation. | Prioritize high-yield sites and maintain systems well to maximize lifetime clean-energy production. |
| Energy payback period | Commonly around 1–3 years for PV systems, varying with technology, location, irradiation, and manufacturing conditions. | Most systems generate substantially more energy over their operating life than the energy used to manufacture and install them. | Choose durable equipment and avoid unnecessary oversizing that increases material use without improving energy value. |
| Peak electricity demand | Solar generation generally peaks around the middle of the day, while residential demand often rises in the morning and evening. | The timing mismatch can reduce savings if electricity exports are compensated at a lower rate than imports. | Combine load shifting, smart controls, and appropriately sized storage. |
| Simple annual output estimate | Annual energy ≈ system capacity (kW) × local peak-sun-hours per day × 365 × performance ratio. | This provides a transparent first estimate before detailed engineering analysis. | Use local measured or modeled solar data and verify the result with a professional design study. |
| Best 2026 optimization priorities | Reduce shading; improve direct consumption; electrify suitable loads; add storage only when its value exceeds its cost; monitor system performance. | Solar value increasingly depends on flexible demand, grid conditions, electricity tariffs, and resilience needs. | Review production and consumption data monthly and adjust operating schedules seasonally. |
Related Posts
-

China Top Benefits of Solar Energy for a Sustainable Future
-

Top Clean Energy Solutions for Global Buyers
-

Top Solar Energy Panel Trends in 2026 for Global Buyers?
-

What Makes China Best for On Grid Solar Systems?
-
China Top 10 Solar Power Generation Projects Transforming Energy Landscape?
-

Top Renewable Energy Solutions in China for Global Buyers?